A dev panel that knows why the experiment isn't running
Generic devtools show you state. The Toolbox dev panel cross-references the trigger contract, the targeting condition and live attributes — and names the exact clause blocking enrolment.

Half of QA’ing an A/B test comes down to one question, and it is never “what are the current attribute values”. It is: why isn’t my experiment running?
The way we run experiments makes that question sneaky. Every test in our GrowthBook Toolbox is code, injected on a client’s production site, and enrolment is gated twice: an activation trigger in the experiment’s code (element-loaded, page-condition, viewport, and friends) writes a value into a GrowthBook attribute array, and a targeting condition in GrowthBook checks that array. Two halves of one contract, defined in two different places, by two different tools.
Which means there’s a whole class of failure where everything looks green and nothing runs. The trigger fires beautifully and writes loadedElements — but the condition checks pageConditionsMet. The provisioning script derives pageType: "pdp" from the ticket — but the site’s runtime reports "product". No error, no warning, no enrolment. We’ve been bitten by both of these. More than once.
This is what our dev panel says about that first bug now:
CRO-744  ● blocked
   loadedElements — wants [cro-744], got []
   ⚠ value found in "pageConditionsMet" — condition checks a
     different attribute than the trigger writes
The exact mismatch that once cost us an afternoon, rendered as one glance.
The official GrowthBook DevTools extension can’t do this, and it’s worth being precise about why. It shows you the attributes (live, even) and it shows you the features. Two JSON blobs, technically complete. Spotting that a value sits in the wrong array is still entirely your job — the extension doesn’t know that element-loaded writes loadedElements, because that contract is ours, not GrowthBook’s.
So I taught our dev panel the contract. The Toolbox holds all three pieces client-side: it knows which trigger type writes which attribute array (that’s its own trigger system), it can read the actual targeting condition from the SDK payload (growthBook.getFeatures() — the rules are right there), and it obviously has the live attributes. Cross-referencing the three turns a viewer into a diagnosis. The panel walks the condition clause by clause — equality, $in, $elemMatch, regex, $and/$or/$not — and names the failing clause with a wants/got. On top of the raw evaluation sit the toolbox-specific lints: a failing trigger-array clause whose expected value sits in a different array gets flagged as a contract mismatch, and a condition checking an array that none of the experiment’s declared triggers ever writes gets called out as unwinnable. It also distinguishes “flag not in the payload at all” (wrong environment, missing flag) from “no experiment rule” (draft or stopped) from “condition met — blocked by coverage or hash”. Each of those used to be a separate investigation.
One honesty rule made the whole thing trustworthy: anything the evaluator can’t parse with confidence — saved groups, gnarly $or nesting — is reported as unverified, never guessed. A diagnostic tool that bluffs is worse than no tool.
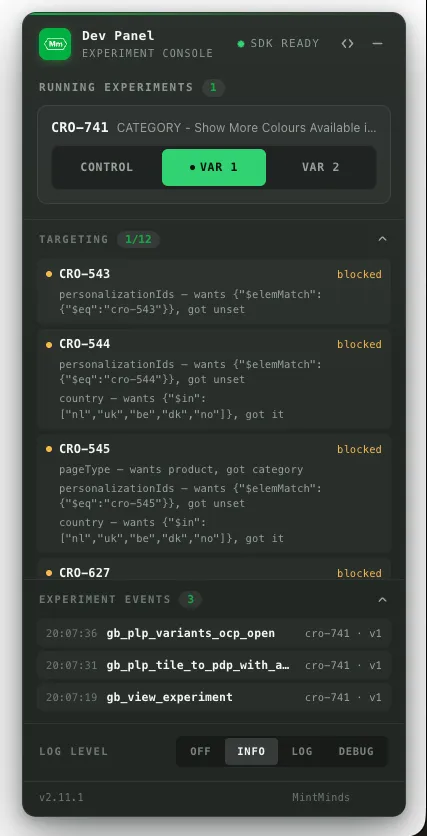
Every blocked experiment carries its own reason — personalizationIds wanting a $elemMatch it never got, a pageType that wanted product and got category. No expanding JSON, no guessing which of twelve targeting clauses is the one that bit you.
The dataLayer already remembers
The second QA loop the panel closes is tracking. Our experiments report through a small tracking helper that pushes gb_-prefixed events to the dataLayer. The panel shows them as a live feed — but the fun part is the backfill. Conversion events fire at experiment start, a second before a lazily loaded panel exists. No buffering infrastructure needed: the dataLayer is the history.
const backfill = (window.dataLayer || []).filter((item) =>
	item?.event?.startsWith("gb_")
);
backfill.forEach((item) => recordEvent(item));

onDataLayerPush({
	match: (eventName) => eventName.startsWith("gb_"),
	callback: (data) => recordEvent(data)
});
Scan the array, then register the interceptor — both in the same synchronous tick, so nothing falls through the gap and nothing gets counted twice. Every experiment event since page load, timestamped as they stream in, without keeping GA4’s DebugView open in a second monitor.
The rest of the cockpit
Around those two sit the instruments you’d expect, each answering its own question. Is the SDK alive? A status lamp in the header — amber while init is in flight, green once the payload loads, red when it fails, which is precisely the signal you need when the experiment list is empty and you’re wondering whether it’s targeting or a blocked fetch. What’s running, and can I flip it? A segmented control per experiment with targeting-safe variation forcing — a green dot always marks GrowthBook’s genuine assignment, so you can find your way home. What changed, and when? The targeting drawer also shows the live attributes themselves — enrolment-gating values first, environment noise demoted — and every mutation flashes as it lands, with a timestamped feed of the last few changes, so you can watch a trigger fire instead of diffing JSON in your head. There’s a log-level switch for the trace output when you need the panel to narrate, and the footer carries the toolbox version — a small thing, but on a client’s live site it’s the quickest way to confirm which release is actually serving. And when you minimise it all to its pill, the experiment count rides along and a pulsing indicator keeps warning you about active overrides — a forced variation you forgot about is a QA session invalidated.
The whole thing activates behind a query-string flag on any client site and rides along in the production bundle behind a lazy import — zero bytes executed for real visitors.
There’s a general principle underneath: generic devtools can only ever show you state, because state is all they can see. A tool that knows the contracts of the system it lives in can show you conclusions. Ours knows that triggers write arrays, that conditions read them, and that the two are supposed to meet — so it can tell you, in one line, exactly where they didn’t.
Happy debugging 🔍